Your Top Choice for In-Home Care
301.562.1100
On Its 30th Anniversary, Options For Senior America Has A Compelling Story With Over 42,000 Care Providers and 56,000 Care Recipients
This year marks the 30 th Anniversary of Options for Senior America (Est. 1989)
In its 30 years of service, Options has screened over 42,200 care providers (CNAs, HHAs, LPNs and RNs) and assisted over 56,500 care recipients in making an informed decision about home care services. It is important to note that this data came from the 11 states where Options offers their services through its own operations or its franchises. These states are Maryland, DC, Virginia, N. Carolina, Georgia, Florida, Ohio, Pennsylvania, New Jersey, Indiana, and West Virginia.
As a result, Options has compiled some historical data that tells a compelling story. Home care refers to medical treatment or assistive care for patients who do not require hospitalization or facility care, but do need additional support to live safely at home. Home care can involve medical treatment by medical professionals, but the largest segment of home care involves assisting individuals with daily tasks such as bathing, dressing, and eating. Such help is carried out by caregivers, or other licensed or unlicensed non-medical personnel. Most of those receiving home care in the U.S. are over 65 years old, with approximately 96 percent requiring assistance with bathing and 88 percent requiring assistance transferring in and out of bed. (Ref Statista.com)
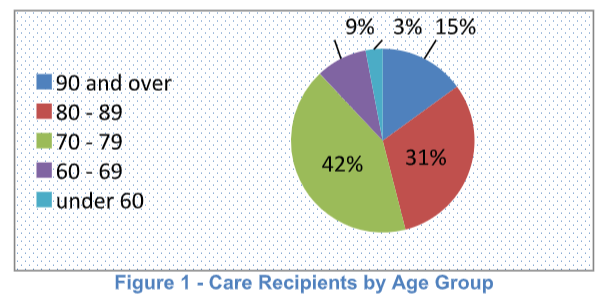
Statistics derived from the 56,572 patients that Options fielded in the past 30 years show that 42% of them were in their 70’s, and the rest were spread among the following age groups:
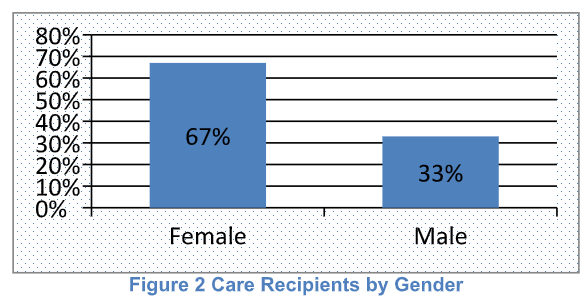
These figures are very close to those derived from Options’ 56,572 care recipients where two thirds of them are female and one third male. (Figure 2)
Though national statistics show that 75% of all non-paid caregivers (i.e. caregivers who are family members to the care recipients) are female, this percentage is different for paid caregivers. Out of the 42,207 caregivers vetted by Options in the past 30 years, about 90% are female and 10% are male.
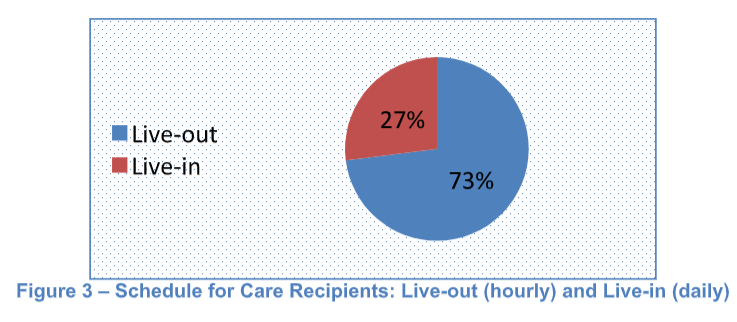
These figures differ substantially when it gets to paid care givers. Out of the 56,572 care recipients that entered Options database in the last 30 years, the majority of them required more personal care assistance including help in bathing, dressing, shaving, grooming, and transferring than companionship. 73% of these care recipients needed care anywhere between 2 hours and 12 hours a day, and 27% needed around the clock live-in care. (see Figure 3).
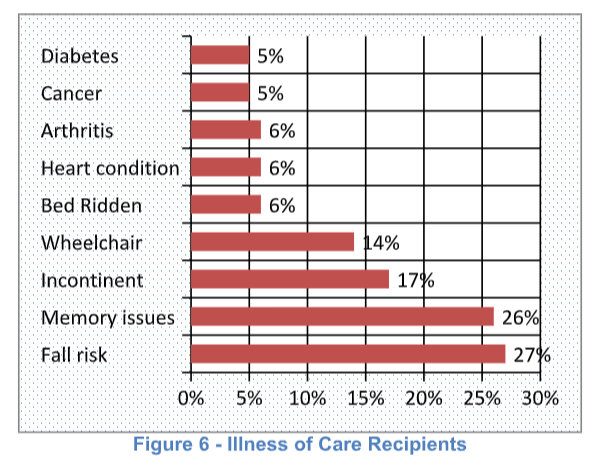
The illnesses of these 56,572 care recipients varied from Alzheimer’s (and other related memory issues) to fall risk vulnerabilities, incontinence, heart conditions, Arthritis, Diabetes, confinement to bed and wheelchair. (see Figure 6)
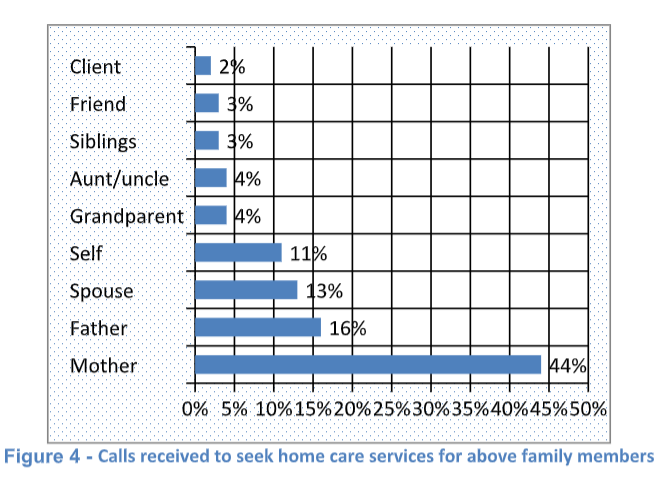
People who called Options in 11 states over the past 30 years, inquiring about services for their loved ones, were related to the care recipient in various ways. 60% of callers inquired about care for their parents, 13% for their spouse, and 11% for themselves (see Figure 4 for more details).
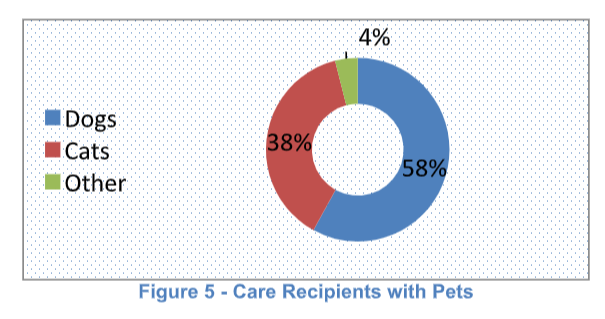
Out of the Care recipients who had pets in their homes, 58% had dogs, 39% cats and 4 % other pets (see Figure 5).
The value of the services family caregivers provide for "free," when caring for older adults, is estimated to be $375 billion a year. That is almost twice as much as is actually spent on homecare and nursing home services combined ($158 billion). Evercare Survey of the Economic Downturn and Its Impact on Family Caregiving;
According to the US Census Bureau, the nation's 65-and-older population is projected to reach 83.7 million in the year 2050, almost double in size from the 2012 level of 43.1 million. A large part of this growth is due to the aging of baby boomers (individuals born in the United States between mid-1946 and mid-1964), who began turning 65 in 2011 and are now driving growth at the older ages of the population.
"The United States is projected to age significantly over this period, with 20 percent of its population age 65 and over by 2030," said Jennifer Ortman, chief of the Census Bureau's Population Projections Branch. "Changes in the age structure of the U.S. population will have implications for health care services and providers, national and local policymakers, and businesses seeking to anticipate the influence that this population may have on their services, family structure and the American landscape."
Options for Senior America has geared itself to accompany this growth in the coming 3 decades by providing services not only in the 11 States where it currently has presence, but to enlarging its network to cover the entire US through its franchise system which has witnessed a lot of traction in the past 10 months.